JetBrains Rider, The cross-platform .NET IDE from JetBrains, has been my defacto .NET development environment for over a year now (maybe even two). Having the same tool across macOS and Windows environments is a joy, and with every iteration, the team at JetBrains puts out, the product gets better. I want to show you a feature I recently discovered working on my Hypermedia Lite post (I suggest you check it out if you’re an ASP.NET Core developer).
This trick will have you debugging like a champion.
Debugger Magic
With every additional language feature, comes a new and necessary way to debug your applications. While property initializer syntax is not new, it can make it difficult to debug issues. Let’s look at an example, and what folks may do to debug the issue.
static void Main(string[] args)
{
    // local function
    int two()
    {
        return One() + One();
    }

    var results = new List<Data>();
    for (int i = 0; i < 10; i++)
    {
        results.Add(new Data {
            One = One(),
            Two = two(),
            Characters = Characters()
        });
    }
}
A few things are happening in the code above.
- We are adding a new
Dataclass toresults. - We are calling methods
One,two, andCharacters -
twois a local function
What if you were curious about what’s happening in an iteration of the loop? Well, some of us might modify the code to something like this.
static void Main(string[] args)
{
    // local function
    int two()
    {
    return One() + One();
    }

    var results = new List<Data>();
    for (int i = 0; i < 10; i++)
    {
        var data = new Data();
        data.One = One();
        data.Two = two();
        data.Characters = Characters();

        results.Add(data);
    }
}
The above code simplifies the syntax we were using, and now we could add a breakpoint on each line. Functional, but not Fun.
But wait! You don’t have change anything!
JetBrains Rider can help.

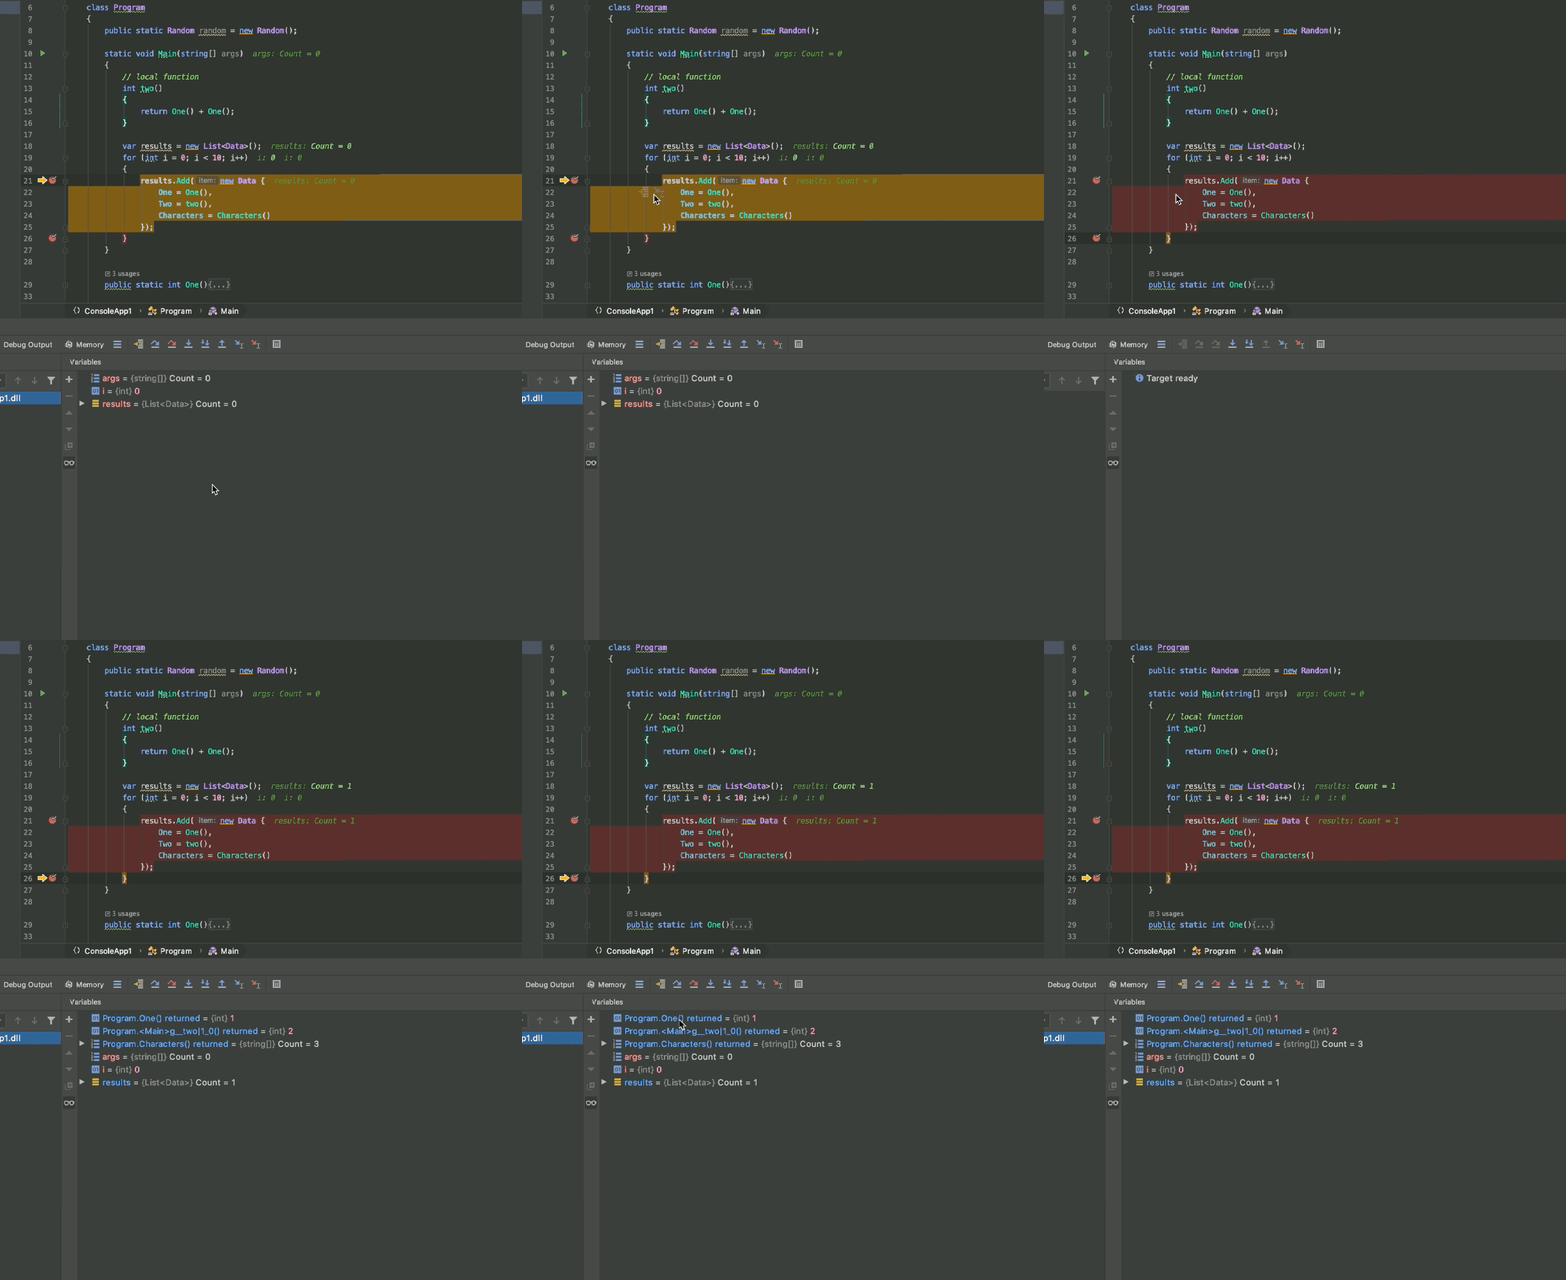
Did you see that? As we step over the code, keep an eye on the Variables window at the bottom of the video. You’ll notice that the debugger is keeping track of return results.
Amazing! What a time to be alive. I hope this feature helps you debug faster.

 Photo by

