I’ve spent the better part of the week diagnosing a memory leak in a Windows Azure App Service. You may find this post helpful if you find yourself in the same situation I was in. I’ll walk through what a memory leak looks like and the steps you can take to diagnose and eventually solve the issue. Every application is different, so an understanding of your codebase will lead you to make the best decision to resolve your issues.
The Leak
Hopefully, you catch the memory leak before your users start screaming bloody murder. To give yourself the best chance of that, I recommend installing Azure Application Insights. Once your application starts behaving badly you have two exploratory options:
- Live Metrics: Seeing how the application is behaving right now.
- Metrics: Seeing how the application has behaved.
Both are seen here in the Application Insights blade.
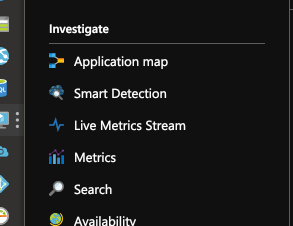
Using Live Metrics
Live metrics is my first stop of choice. I want to see how much memory my application is currently using.

The current memory footprint will be on the bottom of this page and will look similar to the screenshot above. If it is high, the next step is to look at the Metrics tab.
Metrics Tab In Azure
When on the metrics tab, you will be presented with several drop-down options. Choose process private bytes.
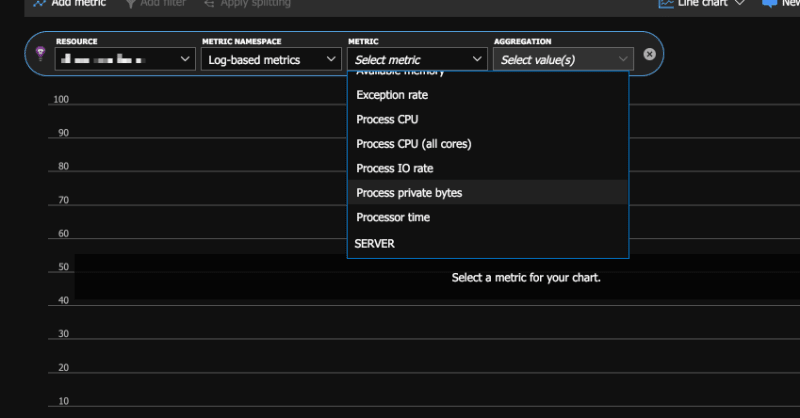
If you see a sawtooth pattern, then congratulations, you have a memory leak.

Taking a Memory Dump In Azure
Once you’ve determined you have a memory leak, its time to get a memory dump. Head back to your app service blade. Here you will click the Diagnose and solve problems menu item followed by clicking the memory dump button under Diagnostic tools.
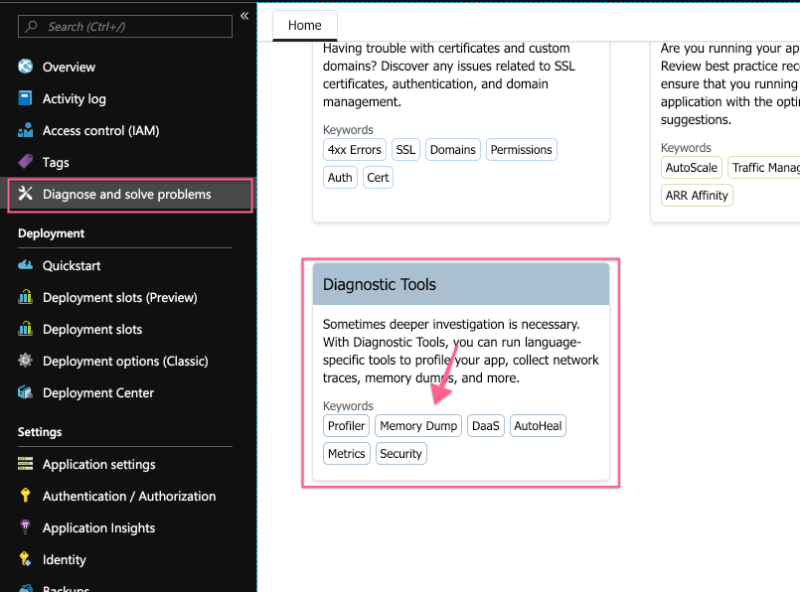
Once there, open a Collect Memory Dump tab and click the Collect Memory Dump button. Don’t worry about analyzing the data, as we don’t really need it but it doesn’t hurt if you choose that option either. Two dump files will be produced, and you should be able to download a .dmp file of the w3wp process which hosts your web application.
Note: you may have to download the mscordacwks.dll from your app service. This can be found under C:\Windows\Microsoft.NET\Framework\v4.0.30319 directory.
Perfview
Note: The following is not an actual memory leak, just an example of using PerfView.
You’ll need to download PerfView from the official GitHub page. Once downloaded, run the application.
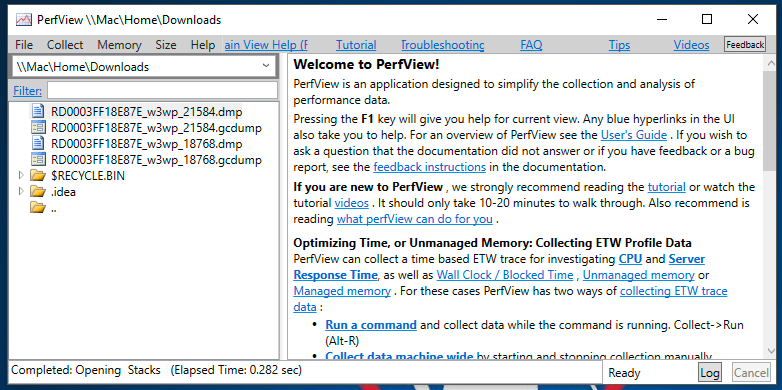
Process your .dmp file, which should produce a .gcdump file and open up the results.
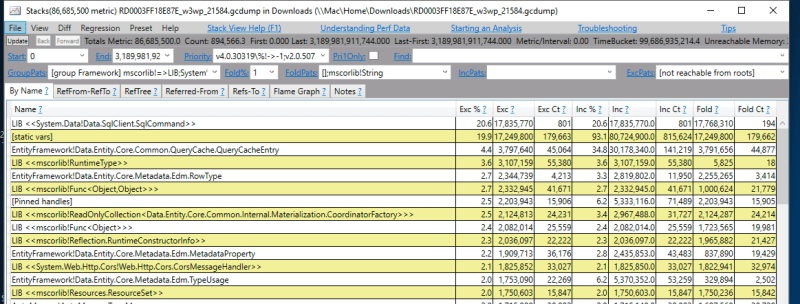
When looking at this view, you’ll notice a few noteworthy elements:
- The first line is always the object(s) taking the most memory.
- The second column, labeled
Exc %notes how much of your memory is of that type of object. - The
Exccolumn is how manybytesare being used. -
Exc Ctis how many instances exist in the memory dump.
In the screenshot above I know that SqlCommand is using 20% of my memory with 18 megabytes of memory with 801 instances. The Exc stands for exclusive, so it does not account for children objects.
Flame Graph
The next thing I like to look at is the flame graph. The documentation in PerfView suggests this reading:
The graph starts at the bottom. Each box represents a method in the stack. Every parent is the caller, children are the callees. The wider the box, the more time it was on-CPU.
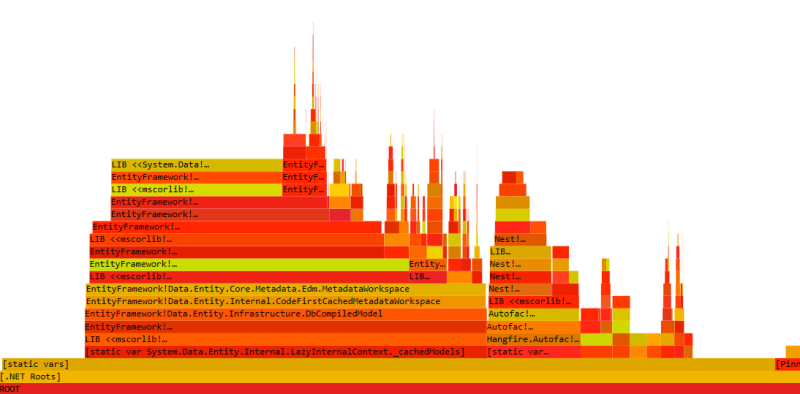
In this example, I can see that most of my CPU time is spent on static variables. Additionally, if you look at the towers from left to right, you’ll note that Entity Framework is using the most CPU with its LazyInternalContext. This aligns with our first view, which stated that SqlCommand is our most memory utilizing object.
If we head back to the By Name tab, located at the top, we can double click the SqlCommand line. This allows us to see where most of the memory is being allocated in reference to this class. By continuing to double click we expand the references to the point we see .NET Roots. This is where it all ends.
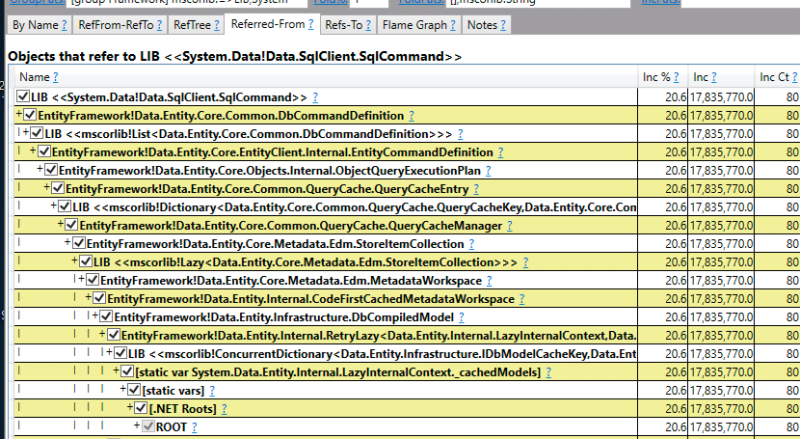
What can we tell about SqlCommand?
-
SqlCommandis referred to by something called aQueryCacheEntry. - a
QueryCacheEntryis referred to by something called aQueryCacheManager - Finally, down near the bottom, all these objects are part of an internal static variable called
_cachedModelsinside ofLazyInternalContext.
This is expected behavior for Entity Framework, but it is nice to know what the library is doing under the covers and whether its worth the memory footprint.
Conclusion
I’ve shown you how to spot a memory leak in Azure using Live Metrics and the Metrics tabs. I’ve shown you how to download a current memory dump from your application. Finally, utilizing PerfView, you can determine which objects in your application may be misbehaving. With this knowledge, you should be able to track down any memory leak and potentially free up resources and make a stable user experience.
I do want to note that I ran into strange behaviors in Azure. I would deploy my application with dependencies removed, but those objects were still in memory. If you find you are running into this issue, restart your application then take a memory dump afterward.
I also want to thank the Twitter .NET Community that gave me a lot of good direction and help when solving my own memory leak. Thank you!

 Photo by

