So you’ve decided to bolt on an existing Blazor WebAssembly (WASM) UI to a current ASP.NET Core solution. First of all, congratulations on taking the first steps to try something new in the world of #dotnet. Secondly, you’re probably reading this post because you’ve spent the last several hours, if not days, scratching your head as to why you can’t debug your brand-new UI. By the end of this post, I hope to give you some suggestions for getting your Blazor WASM client debugging with your favorite IDEs. Let’s get started.
The “Obvious” of WASM Debugging
While coding with Blazor WASM, it’s easy to get lulled into a false sense of comfort. After all, it’s all C# and .NET, right? Well, not exactly. It’s easy to gloss over that while our code runs on a version of .NET, it’s not the one we know and love. It’s different. From the official documentation:
Blazor WebAssembly (WASM) apps run client-side in the browser on a WebAssembly-based .NET runtime.
–Microsoft Docs
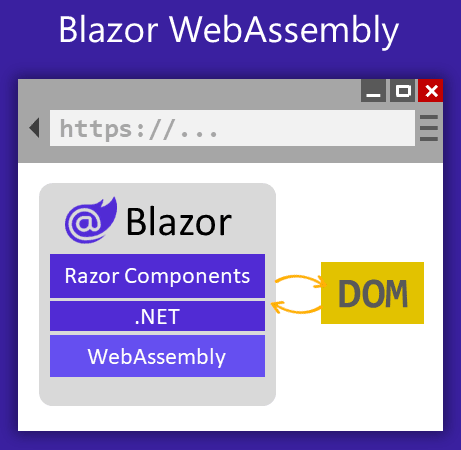
And it’s also reflected in the graphic used on the page, with clear iconography indicating your new Blazor WASM app running in the browser.

You might be thinking, “Khalid, I know Blazor WASM runs standalone in the client; what’s your point?!” Well, where does the debugging happen if your app runs standalone in the client? If you answered “on the client!”, then you’d be correct. All WASM code debugging occurs in the client and is typically proxied to your IDE of choice. That means your tools need a constant connection between your integrated development environment and the client app. Being in the client also means we’re not using traditional .NET debuggers but instead relying on the debuggers found in Chrome dev-tools. Keep that in mind.
Let’s investigate how and where this connection can go wrong and help you debug your Blazor WASM standalone apps.
Chromium Web Browsers Are Required
Currently, Blazor WASM debugging only works with Chromium-based browsers.
- Google Chrome (version 70 or later)
- Microsoft Edge (version 80 or later).
These browsers have the necessary developer tools to connect and communicate with your development environment. Sorry, Firefox and Safari users. You’ll need Chrome installed.
Missing Launch Settings Fields
Most ASP.NET Core projects will come with a launchSettings.json file. Here we can tell the dotnet process how to run our web host application. However, for Blazor WASM hosts, we need a few more settings than we initially had with a vanilla ASP.NET Core app.
"BlazorWithBackend.Server": {
  "commandName": "Project",
  "dotnetRunMessages": true,
  "launchBrowser": true,
  "inspectUri": "{wsProtocol}://{url.hostname}:{url.port}/_framework/debug/ws-proxy?browser={browserInspectUri}",
  "applicationUrl": "https://localhost:7174;http://localhost:5276",
  "environmentVariables": {
    "ASPNETCORE_ENVIRONMENT": "Development"
  }
}
You’ll need an additional inspectUri field and an optional dotnetRunMessages field. The inspectUri field is the endpoint to which the Chromium-based browser will connect via WebSocket. Without this field, no proxy-based debugging is possible.
Missing NuGet Packages
There are two locations where you need to ensure you have NuGet packages installed correctly in your Blazor WASM solution: The client and the server.
The Blazor WASM client project requires you to install two NuGet packages:
Microsoft.AspNetCore.Components.WebAssemblyMicrosoft.AspNetCore.Components.WebAssembly.DevServer
The DevServer package includes the BlazorDebugProxy required to connect the client and IDE. Without this package, you aren’t debugging anything.
The Blazor WASM host, also need the following package of Microsoft.AspNetCore.Components.WebAssembly.Server, which includes the necessary middleware to host your Blazor application.
Misconfiguration of Blazor Middleware
You’ll need several pieces of middleware to get debugging working, specifically the UseWebAssemblyDebugging method call. In addition, the order of middleware registrations requires to be accurately registered. I’ve included a correct sample below from the default templates.
var app = builder.Build();

// Configure the HTTP request pipeline.
if (app.Environment.IsDevelopment())
{
    app.UseWebAssemblyDebugging();
}
else
{
    app.UseExceptionHandler("/Error");
    // The default HSTS value is 30 days. You may want to change this for production scenarios, see https://aka.ms/aspnetcore-hsts.
    app.UseHsts();
}

app.UseHttpsRedirection();

app.UseBlazorFrameworkFiles();
app.UseStaticFiles();
app.UseRouting();
app.MapRazorPages();
app.MapControllers();
app.MapFallbackToFile("index.html");
Enabling The JavaScript Debugger
Remember how I said previously that EVERYTHING HAPPENS IN THE CLIENT? Well, you need to enable the JavaScript debugger in your favorite IDE. Personally, as a JetBrains Rider user, it’s as simple as checking the with JavaScript debugger checkbox found in the run configuration from your server host.
Running the Correct Run Configuration
This tip is specifically for JetBrains Rider users. After enabling the JavaScript debugger, you might accidentally start the JavaScript Debugger run configuration. This allows Rider to connect to an existing running app, but doesn’t start your host application if it is not already started. This might cause your browser to launch and hang on Blazor’s “Loading” screen. If you find yourself waiting longer than you expect, double-check the run configuration you launched.
Global.Json and .NET 6
As of writing this post, some of your IDEs only have support for .NET 6 debugging. If you have any preview versions of .NET installed, you may want to set your global.json file to lock the SDK version to the .NET 6 band.
Restart the Chrome Instance, No The Other One
So when debugging Blazor WASM apps, your IDE might start a brand-new instance of Chrome with different settings. Check your taskbar and dock for multiple instances of Chrome. Locate the one your IDE started and quit and retry the debugging process.
It’s common to see messages saying: “Blazor Wasm Debugging: lockfile exists, connecting to already running browser”. The message means you have the debugging instance of Chrome still running from previous attempts.
Shut it down and try again.
Conclusion
Woah, that was a lot of tips to get Blazor WASM debugging up and running, but hopefully, you are now looking at a paused instance of your Blazor WASM app. If you’re still struggling to get Blazor WASM debugging working, feel free to reach out to me on Twitter at @buhakmeh, and with any luck, we can get it working for you. Cheers.

 Photo by

